Readers of this blog may remember last year when I wrote about this awesome visual console Python debugger called PuDB. I suggest you read that post if you haven’t.
At the end of that post, I noted that Ondřej and I had hacked it to make the colors more livable. Well, a couple of weeks ago, GitHub user jtriley sent me an email asking me to back port my changes.
A lot has changed since I wrote my blog post last year. PuDB now has an official mailing list and an official GitHub repo.
So I deleted my GitHub clone and reforked from the official version.
A lot has also changed in the official code. Andreas had added config support, including a built-in prefs dialog that lets you set a few settings: the ability to turn on or off line numbers and the ability to change themes.
So I took the new code and added my theme as an official theme. This was pretty straight forward to do.
But then, I got a little carried away.
I noticed that it was difficult to choose a theme with the built-in prefs window because you had to close and reopen the window each time you made a change. So I added code to make it auto-update your changes as you made them.
Then I went back and looked at my original blog post and looked at the things that I didn’t like. There were two things. First, the default stringifier for variables is type, which is completely useless. This is because type is very fast and stable to compute. I had previously hacked this to be str, but now that there was an official config file with a prefs dialog, I figured it should go there.
So I added support to change this setting. But this wasn’t enough for me. I also added the ability to define your own custom stringifier. You just create a Python file that defines a function called pudb_stringifier(obj), which converts obj into the desired string representation. I included an example file that gives a fancy example that uses signals to compute the string value, but times out after one second and falls back to the type. This alleviates one of the problems of using str, which is that it can be slow for objects with large string expressions, especially SymPy objects, where sometimes the printer can be slow.
The second thing I didn’t like was that although you can change the width of the right-hand side bar, you could not change the relative heights of the variables, stack, and breakpoints boxes. I never use breakpoints, and rarely use the stack, so I would prefer to have those smaller and the variables larger. So I implemented it so that the [ and ] keys make the selected view smaller or larger. This information is all saved in the config file, so it’s remembered when you close and reopen PuDB.
There was one other thing that I didn’t like, which a change since my last blog post that reversed the order of the stack variables from what it was. It used to be most recent at the bottom, but it was changed to most recent at the top. This perhaps makes more sense, but the buttons to move around the stack, u and d, were still the same: u moves down the stack (i.e., less recent), and d moves up. These keys were already well established—indeed, these are the same keys used in Python’s built-in debugger pdb—so I added a setting to change the stack order. This was an easy change to make at this point, as I was already well aquatinted with the settings code, and only two lines of code needed to be changed when the setting changed. Like all other settings, this uses the cool magic that changes the setting in real time, so you can see the effect without closing the settings window.
Then someone on the mailing list requested a feature that I realized I also wanted, the ability to wrap variables. Previously, any variable that was longer than the variable view would just be cut off. You could make it wider, but that only helped a little bit. Otherwise, if you wanted to see the whole variable, you had to open IPython by pressing ! and view it there.
So, I implemented this. This was definitely the hardest thing to implement. I found out that it’s ironically very difficult to debug PuDB itself. You can’t run PuDB inside of PuDB if PuDB crashes, as both instances will just crash. Also, PuDB eats any print statements. The solution, suggested by PuDB author Andreas Klöckner, was to get the ttys file of another terminal (e.g., /dev/ttys012) and write the output to that.
I also made it so that non-wrapped variables show ... at the end, at Andreas’s suggestion. I wanted to use the unicode …, but this was not working at all. I discovered how much unicode really is a mess in Python 2. The problem has something to do with … being a three byte character, and I think it also has to do with the color codes that urwid uses. I’ll try it again once PuDB is ported to Python 3, but for now, we are going to have to do with the three ascii dots.
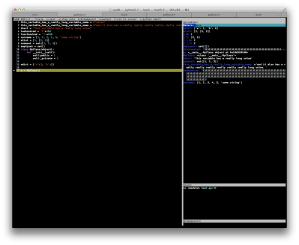
The wrapping code is waiting for merge, but the rest are already in. Here is a screen shot demonstrating some of the things I did:
Things that I implemented to notice here:
– The midnight theme.
– The stack and breakpoints views have been shrunken.
– The variables are wrapped.
– Wrapping for the variable fourhundred has been turned off (you can turn wrapping on or off on a per-variable basis by selecting the variable and pressing w). Notice that there is an ellipsis at the end to note it has been cut off.
– Nested variables now have | before them, to distinguish them from wrapped variables, which are also indented. This change may or may not be accepted by Andreas.
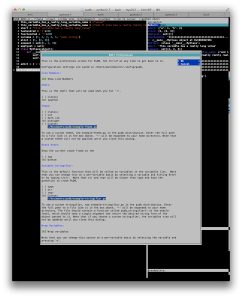
Here’s a screen shot showing the prefs window. I did not implement this, but I did implement all but the first two preferences in the window. I’ve made my window tall so you can see all the options. You really have to get the code and try it to see the auto-update awesomeness. You can open the prefs window by pressing Ctrl-p (this was not at all obvious to me the first time I used it, so I also submitted a patch that makes it open the first time you use PuDB).
So if you’re not already using this awesome Python debugger, you should. You can pip install pudb, or fork it at GitHub.
Running it in your code is very easy. Just add
import pudb;pudb.set_trace()
in your code wherever you want to set a break point, or you can do python -m pudb.run script.py.
This awesome tool has increased my productivity tenfold since I discovered it, and has helped me track down bugs that would have otherwise extremely difficult if not impossible to find. And now, it’s just better.
PuDB uses the urwid library to do all its console GUI magic. This library makes it pretty easy to do a lot of stuff. For example, it automatically does relative sizing of widgets, so, for example, when you resize the variables, stack, or breakpoints views, you are actually increasing the relative size of each, not the size in characters. This makes it portable against any terminal size. The library also made coding the prefs window autoupdate magic very easy.
Also, I just want to note that git and GitHub make collaboration like this very easy. I just forked his project, made some improvements, and submitted them as pull requests. Then it was easy to discuss the changes. If the code had not been on GitHub and especially if it had not been in git, I probably would have never bothered to submit my contributions upstream. I highly recommend that every open source project use git and GitHub.


It looks like you haven’t gotten much response but I just wanted to thank you for your introducing me to PuDB and for your contributions. I was skeptical at it’s “non-GUI-ness” but it’s so easy to use I think it’s actually BETTER that it doesn’t have a GUI. It’s a revelation!
I also saw that you are the lead on Sympy and I wanted to thank you for your contributions there as well! Sympy + IPQT + Latex = Awesome!
Thank you for helping to make python even more awesome and productive!
Well I wouldn’t exactly say that it doesn’t have a GUI. It does have a GUI, just one that is implemented in curses instead of the traditional OS widgets. You do have to use the keyboard, but even that might change at some point (see https://github.com/inducer/pudb/pull/15). To me, what makes PuDB great is that the superiority of actual UI itself (i.e., the layout, the way the interaction is structured, etc.). And since it’s in the terminal, which is where I work with Python anyway (with IPython), I can easily call it up without waiting for a GUI to load or moving away from the window at all. And I can easily access to IPython from within the debugging session, which is almost a killer feature in and of itself.
Glad to hear that my contributions and suggestions are helping people out.
[…] UPDATE 4: PuDB has since improved a lot, include many fixes by myself. It now supports themes, saved settings, variable name wrapping, and more. See this followup post. […]
Pudb is very convenient. Thank you for your work!
[…] If you are interested in running a console-based debugger then you can also execute sudo apt-get install -y python-pudb There are instructions on how to use blogged in this site. […]
Hi there. Love PuDB. Is there a way to save the watch list so I don’t have to re-type it every time?
Thx
It isn’t implemented yet, but it would be great to have. https://github.com/inducer/pudb/issues/64